
Role: Art Direction, Social Content, Illustration
For the 2016/2017 & 2017/2018 season I had the opportunity to work with the team at the Bundesliga to art direct, strategize & produce a series of static & animated graphics for social use. I thought I would highlight my strategy using a selection of graphics created for the final match-day to discuss five types of visual content that sports publishers can create for social use.
project goal:
Create high-impact visuals imbued with relevant narratives focusing on six of the Bundesliga's biggest stories from the 2016/2017 season. To increase reach it was suggested for the relevant Bundesliga clubs to share the content. Examples below: FC Bayern Munich
Types of social content:
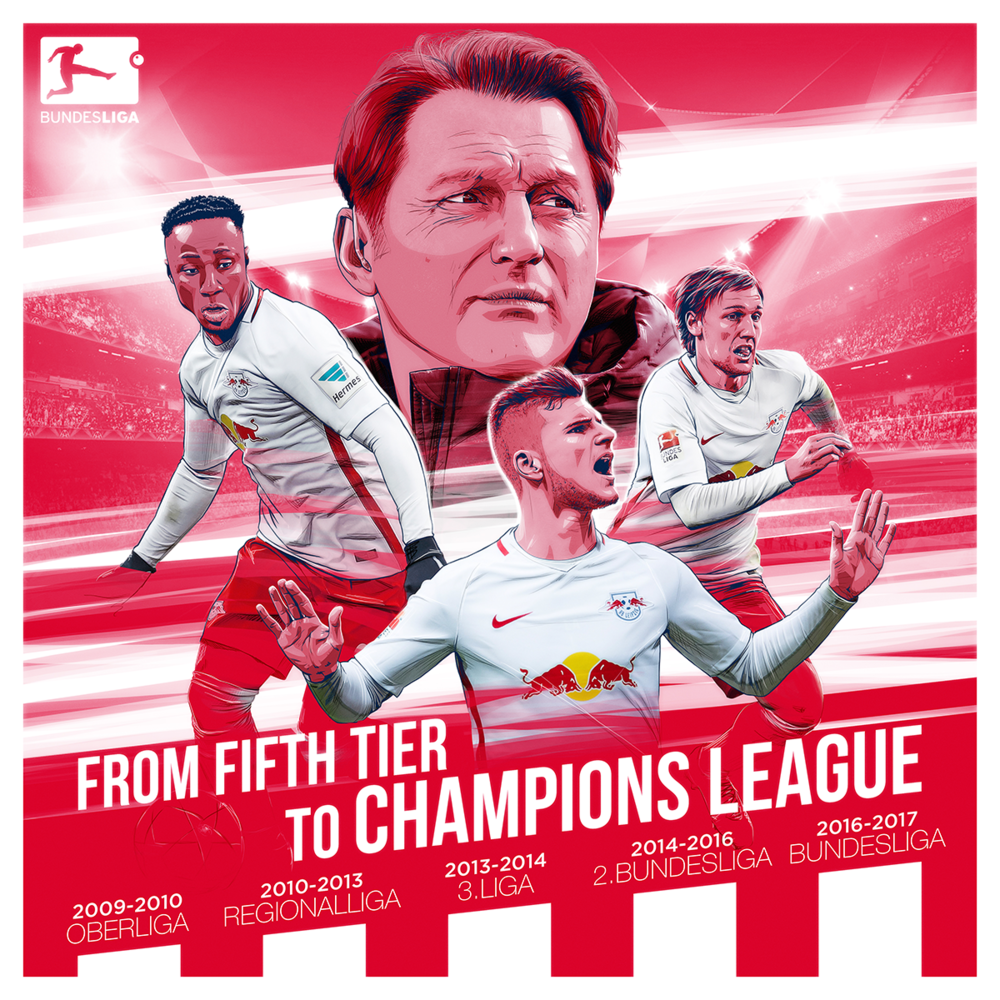
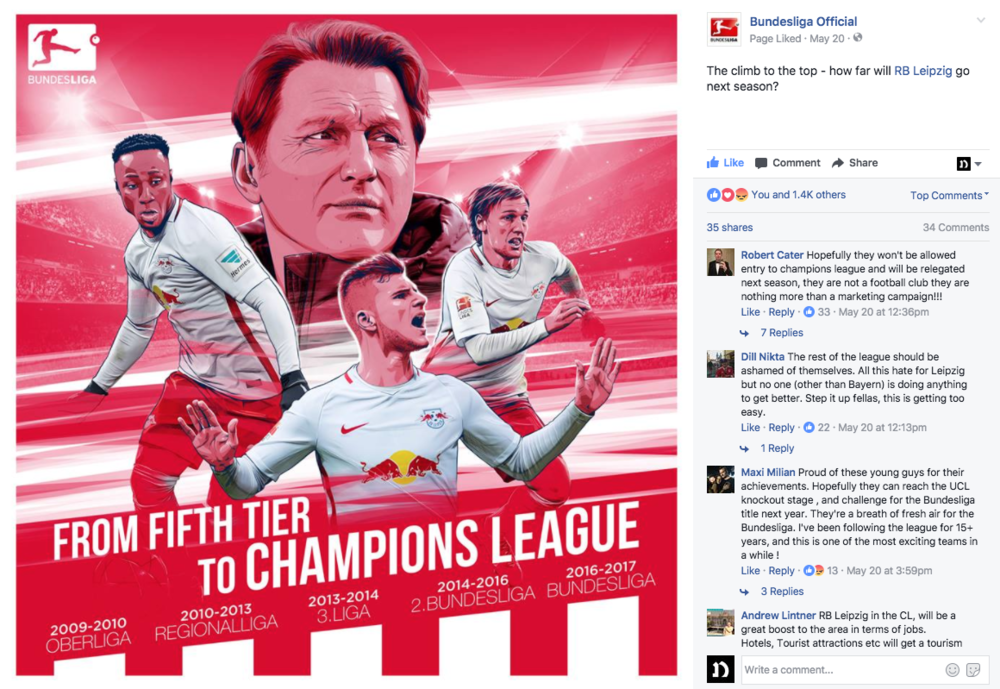
1. Editorial: This type of graphic doesn't accompany a written article but functions very much like one. Traditionally, accompanying editorial illustrations tease the premise of an article or visualize a key point. The social media editorial on the other hand encapsulates the premise completely and doesn't require an accompanying article. Publishers can also easily plug in the graphic into a written article for clicks back to a web hub.
Example 1:
Story: RB Leipzig rose from the fifth tier of German football to the Bundesliga in just 8 years culminating in an incredible first Bundesliga season with the Champions League on the horizon.
Example 2:
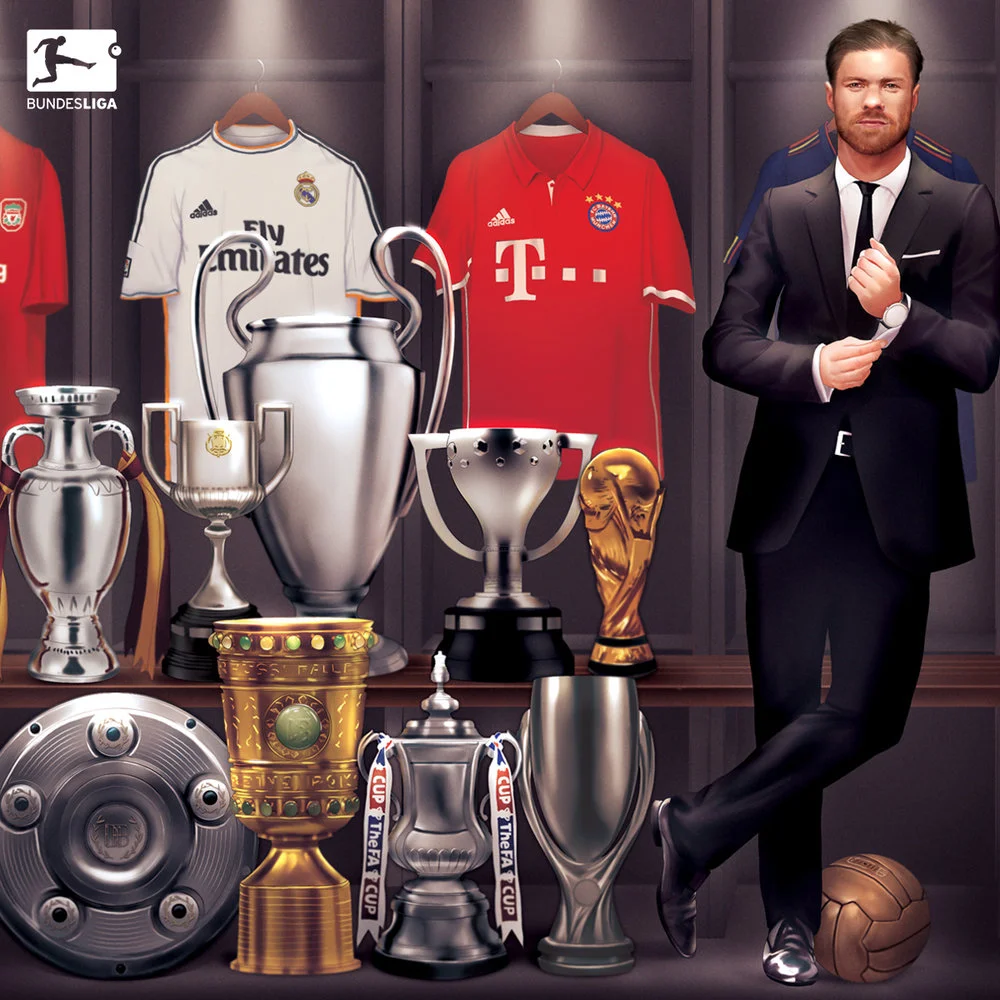
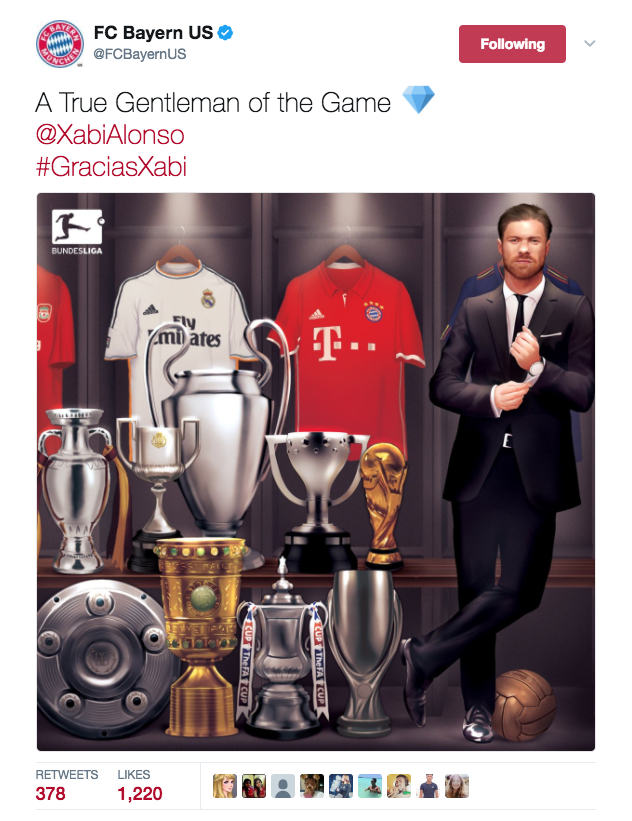
Story: One of football's most chic & sophisticated players; FC Bayern's Xabi Alonso is retiring after playing for Europe's top clubs culminating in a stunning trophy cabinet.
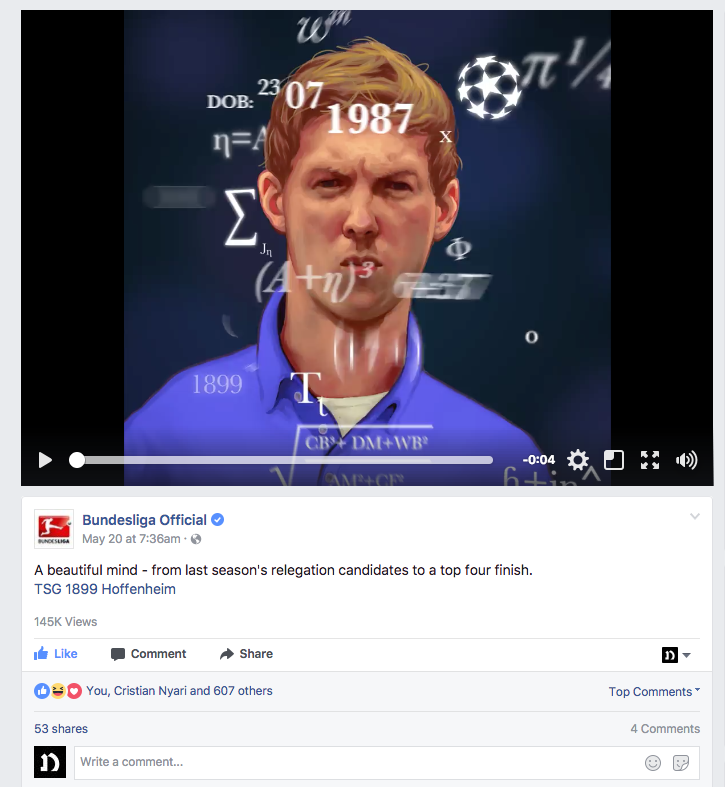
2: Universal Responsive: Primary function of this graphic is to have a long, if possible, infinite shelf-life which means it can be used during time of production or long after as long as the premise holds. One approach to make the graphic "sticky" is to reference a relevant enough meme that acts as an archetypal placeholder.
Example 1: Here I referenced the humerous Zach Galifianakis "Math Genius" Meme that has become a symbolic & visual communicator of wit, intelligence & prodigiousness across social platforms. This graphic was used this season and can be re-used accordingly next season for domestic games, Champions league games, and more playfully for innocuous twitter exchanges/banter.
Story: At only 28 years old, the youngest coach in the Bundesliga; Julian Nagelsmann has given village club TSG Hoffenheim its best finish in Bundesliga history culminating in a Champions League spot. Hoffenheim's incredible season has garnered praise from all over the world for the young football prodigy.
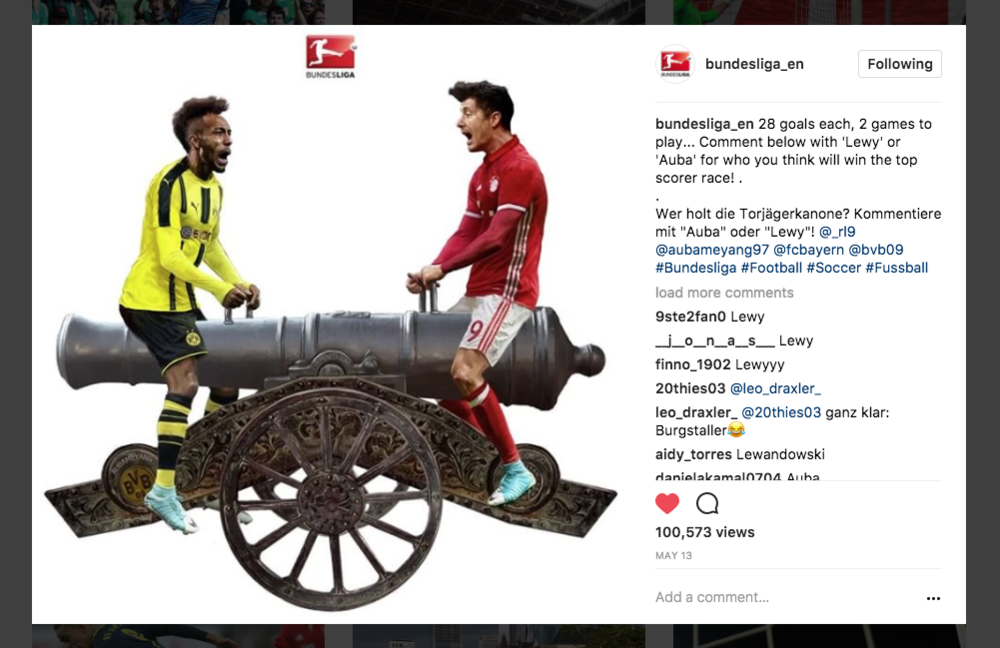
3. Real-time single use: Graphic that functions primarily in limited timeframe, often referencing one specific idea or key insight. Since this graphic is based on a fluctuating premise it's best used in real time.
Example 1: This graphic was used as each of the two players scored, re-emphasizing the narrative until its logical conclusion.
Story: The 2016/2017 season was characterized by a race for the league's top scorer award (TorJägerKanone) between Borussia Dortmund's Pierre-Emerick Aubameyang and FC Bayern's Robert Lewandowski, swinging back & forth until it was decided on the final matchday.
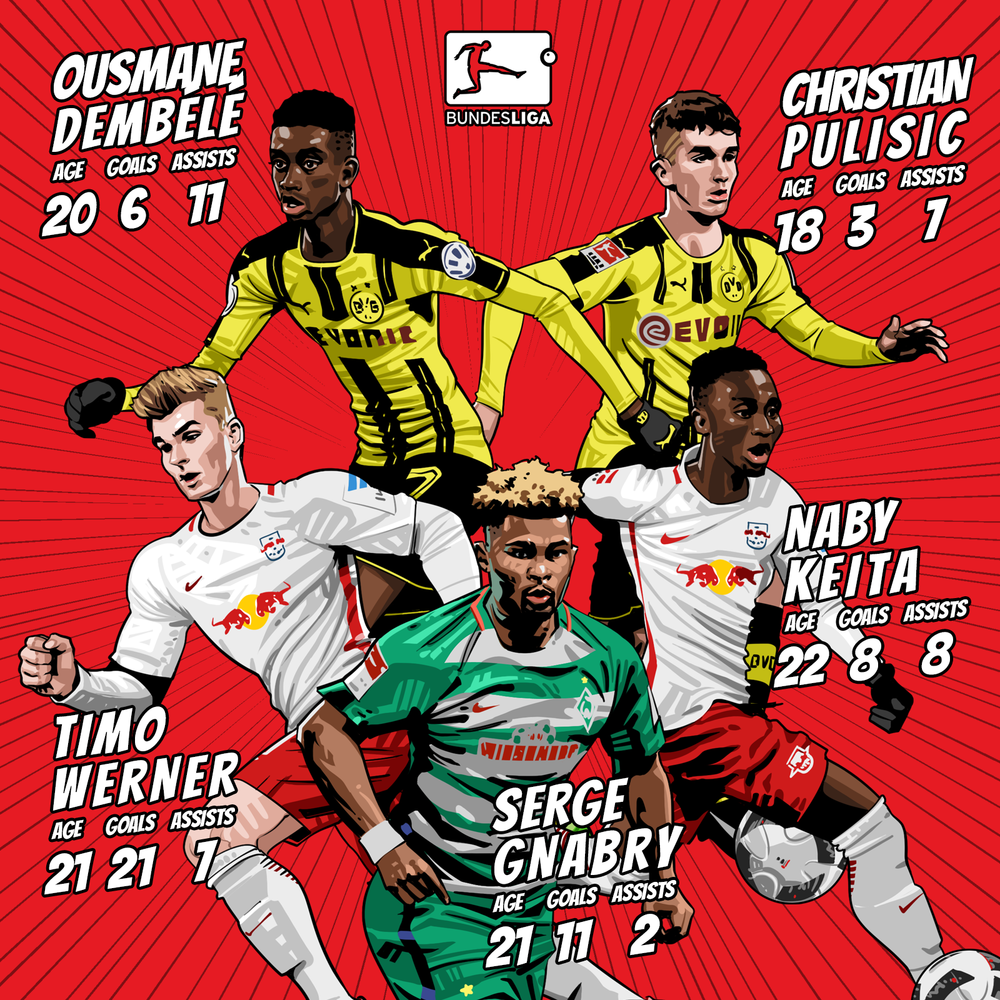
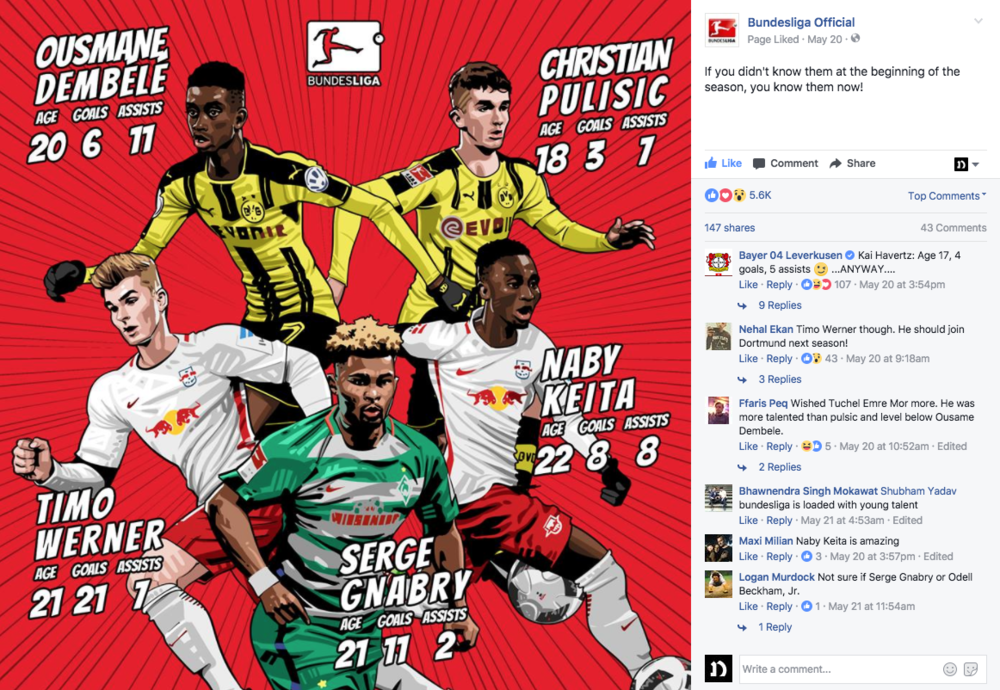
4: Infographic: Graphic that represents data or information.
Example 1:
Story: The Bundesliga consistently features some of the world's most wondrous & exciting young talent. The 2016/2017 season saw the emergence of 5 particular players who stole headlines.
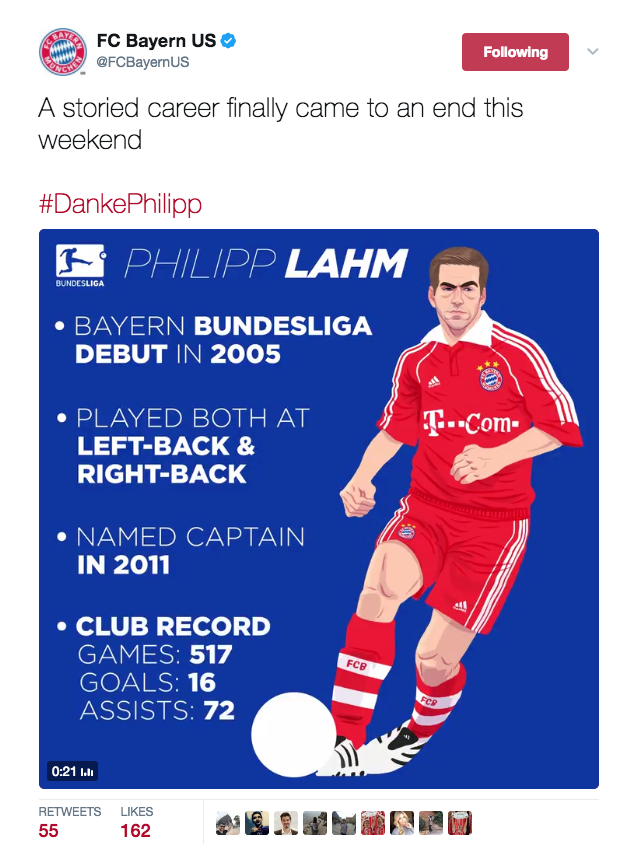
5. Hybrid: These categories are flexible & can often be combined.
Example 1:
Story: Philipp Lahm is retiring after a career that oversaw an illustrious career ranging from a loan at VFB Stuttgart to captaining FC Bayern & captaining Germany to a World Cup win. Created as video & gif.
Here I combined the Editorial & Infographic approach.
Example 2
Story: Stefan Kiessling retires at end of 2017/2018 season.